DataReddit
DataYahooFinanceDJIA
DataYahooFinanceDanskeBank
RedditWordCloud
StockCurve
VaR
 Value at Risk for Danske Bank (DANSKE.CO) stock price (DKK)
Value at Risk: computed with 5-minutes intervals spanning a full day of open market hours, the 5% 1-day VaR is in amount,
-0.8855357142857142857142857
Description: one stock is assumed as market variable. It is assumed that percentage changes during time of historical data are the same as percentage change to the next, V_n, unknown market value V_n/V_(n-1) = V_i/V_(i-1). Historical data is taken from a stock price curve shown on second figure. An estimate for a 5% 10-day VaR can be computed as sqrt(10) times a 5% 1-day VaR.
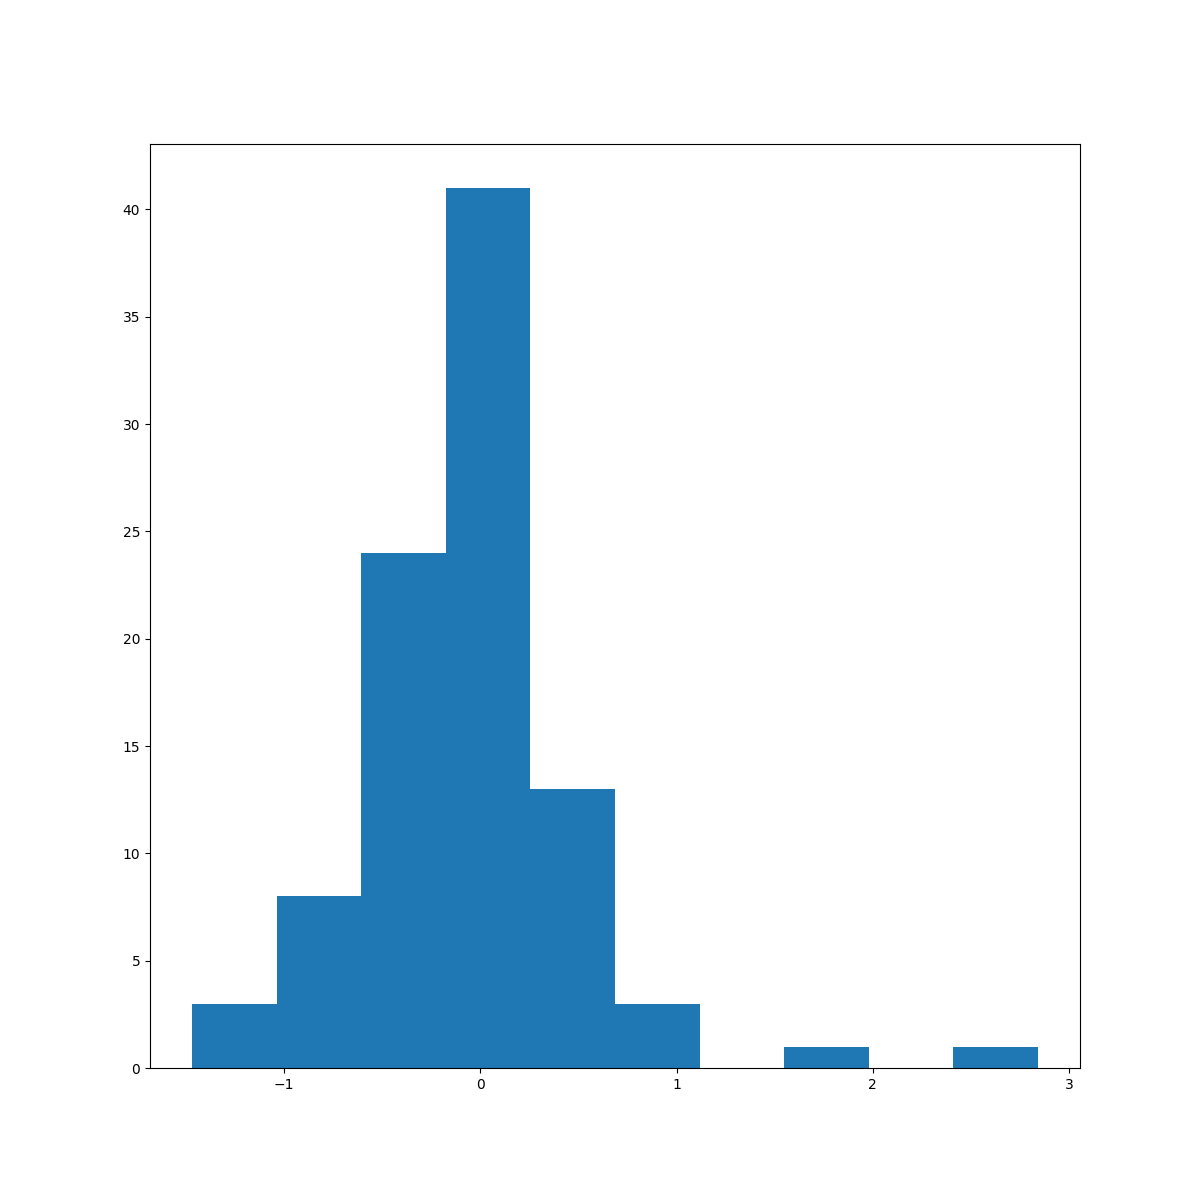
Histogram of Losses and gains
Description: losses have been computed for every scenario derived by subtracting V_(n-1).
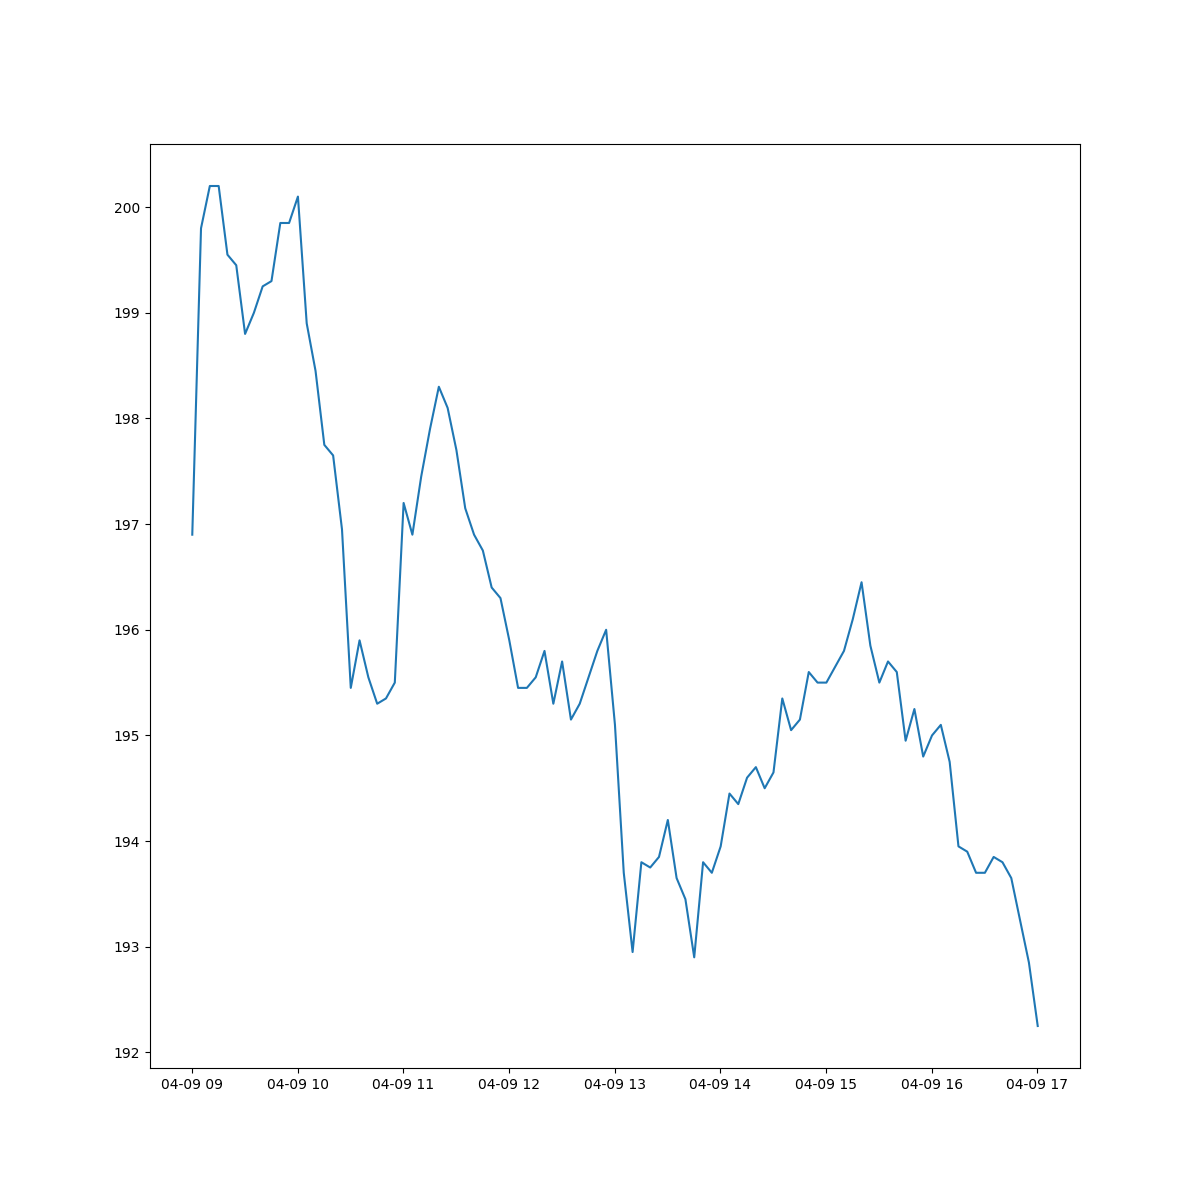
Stock price
Description: historical data is taken from a stock price curve during open market hours where scraping was done every 5 minutes.